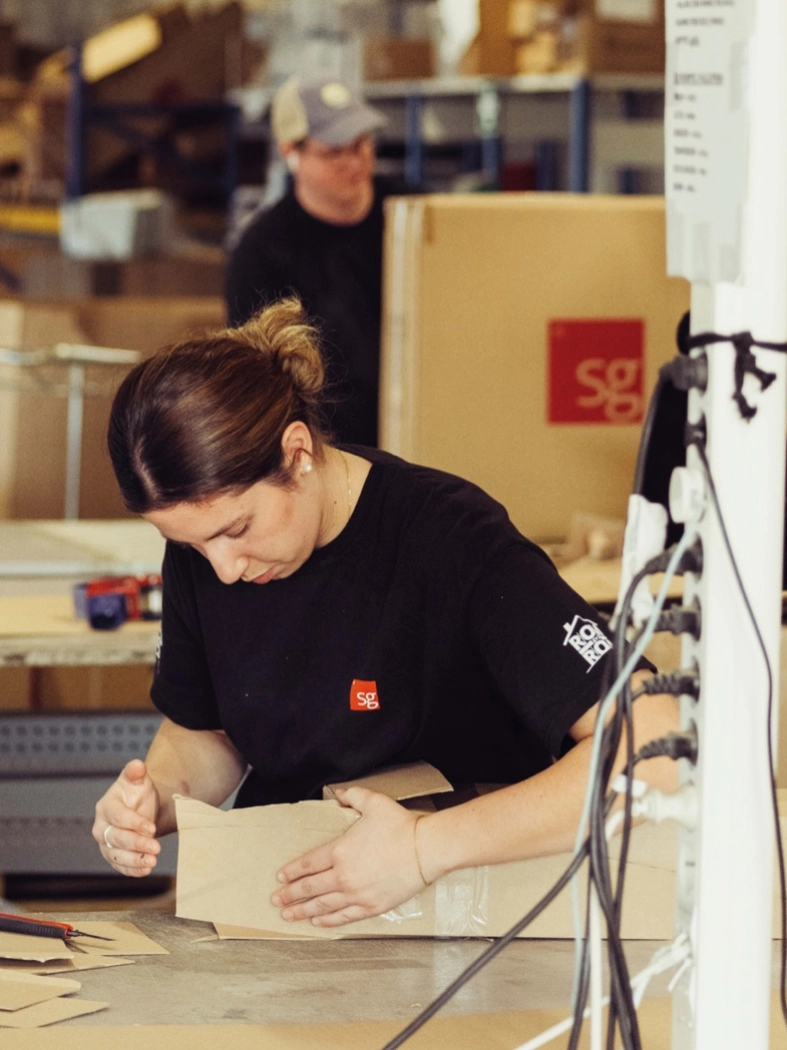
Responsible
We take ownership of our actions and their impact - on customers, colleagues, and society. We comply with laws, deliver on promises, and always strive to do what is right.
We make quality products that last, we publish what each of them does to the climate, and we keep cutting the energy they use. Our LED lighting uses a fraction of the power of the fluorescent tubes and incandescent bulbs it replaces.
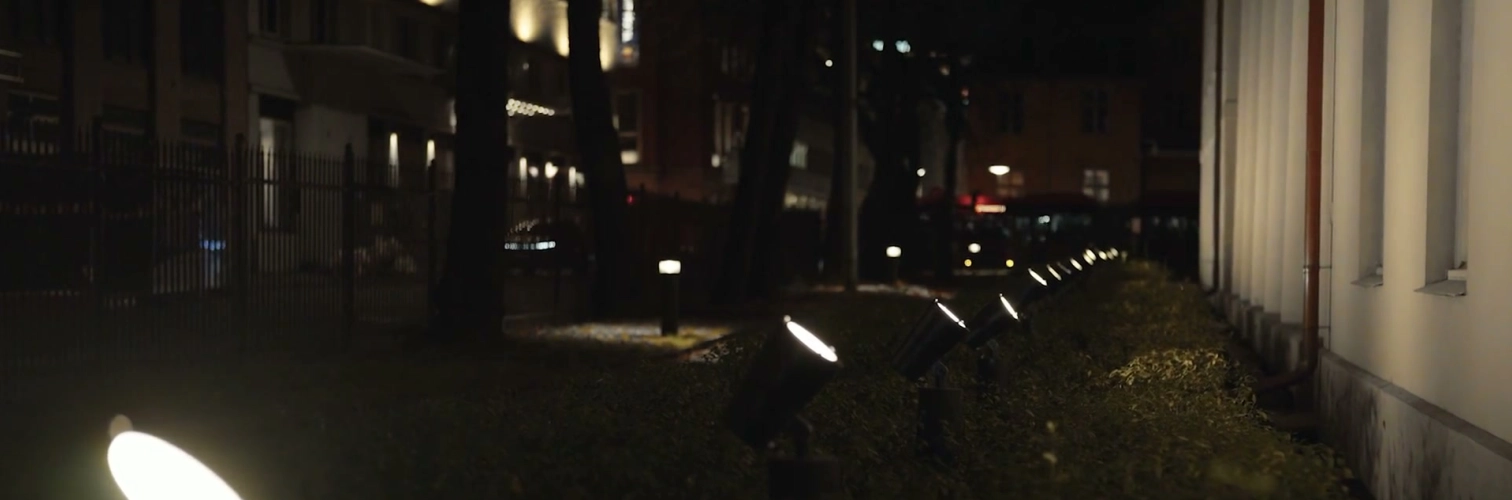
Good decisions start with good information. We design and make our products, so we measure them and publish the numbers, for our customers and for ourselves.
We take ownership of our actions and their impact - on customers, colleagues, and society. We comply with laws, deliver on promises, and always strive to do what is right.
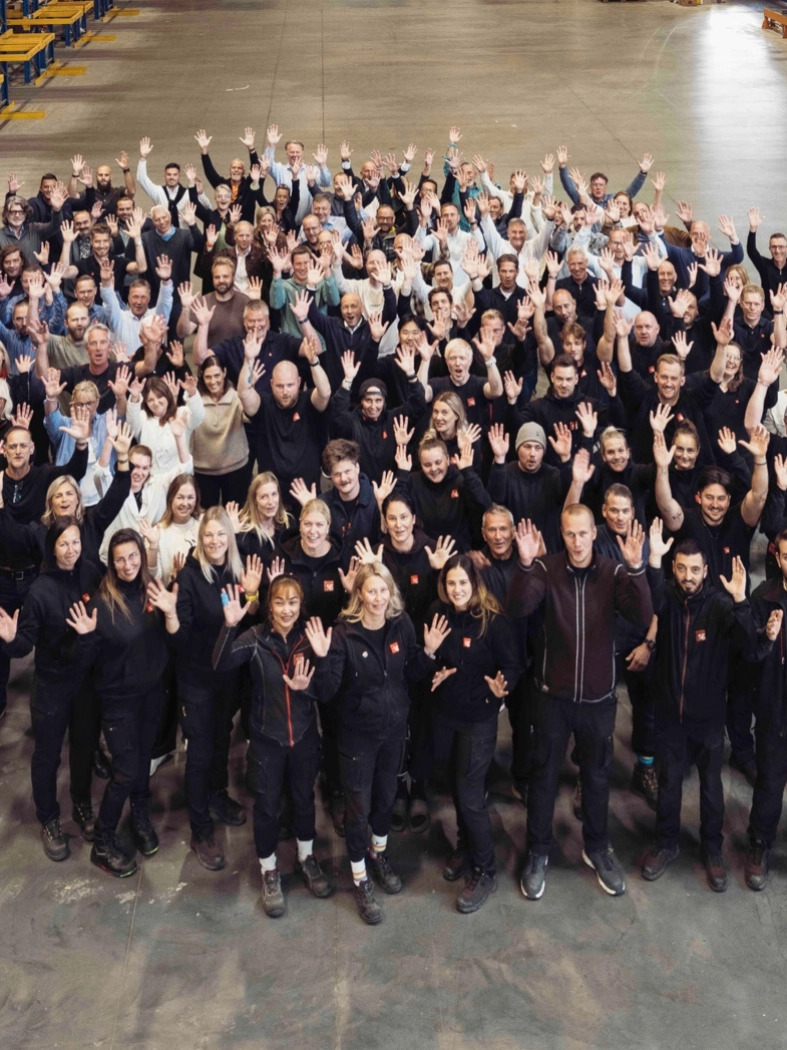
We listen, respect, and collaborate. Whether working across teams or with suppliers and customers, we believe good results come from strong relationships and mutual respect.
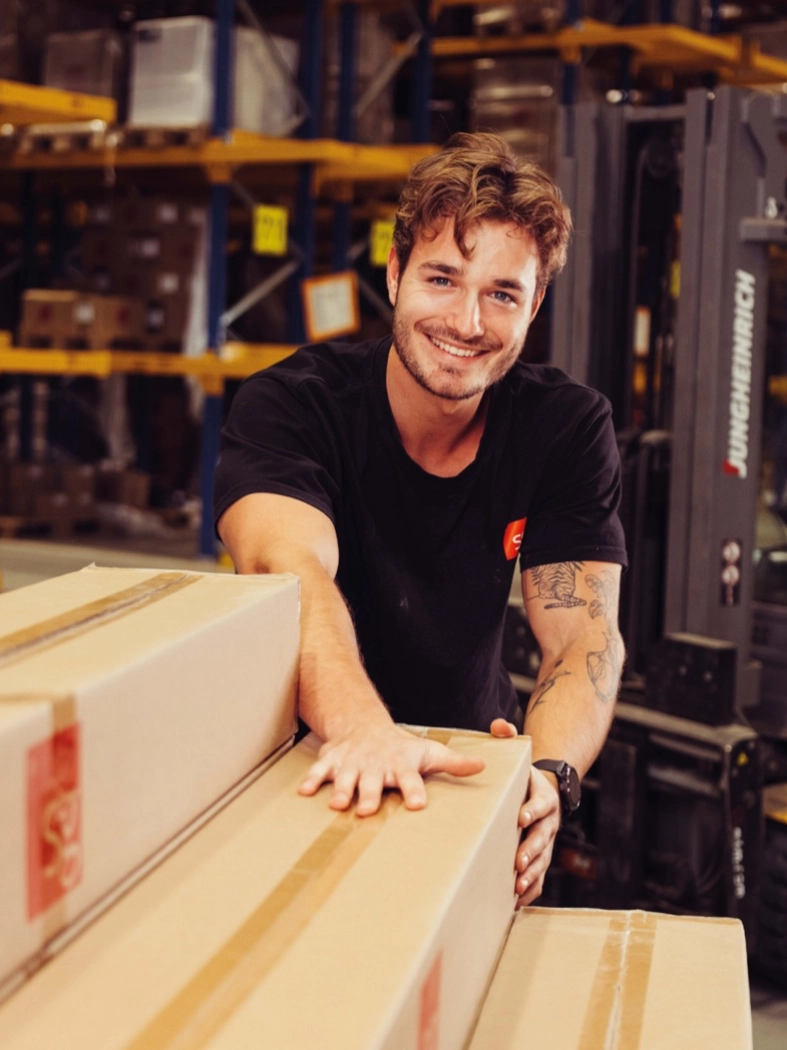
We don’t wait for problems to arise. We take initiative, improve continuously, and anticipate challenges - both in our daily work and in our long-term goals.
We aim to cut emissions from our own operations by 80% by 2030, against a 2022 baseline. The road there runs through our vehicle fleet, our electricity, and our buildings, and it is already underway.
Most of our climate impact sits beyond our own walls: in the products we produce, and in what happens after a luminaire leaves us. Our focus is designing quality products based on long lifetime and optimising energy consumption for customers.
We put people first: a strong, inclusive and safe workplace is what long-term success is built on. The targets we hold ourselves to: zero severe accidents, 40% gender balance, sick leave below 3%.
Business ethics is more than a policy. It is how we act, every day. Three values carry every decision: responsible, people-oriented, proactive.
Raw materials and components are the largest part of a luminaire's footprint, about half on average across our three published declarations. We work to use less material, and recycled or bio-based material where a product allows it. The declarations show what each design choice is worth. We have set no target for this, so the declarations are what we report against.
~50%
Share of the climate footprint, average of three EPDs
Making and assembling the luminaire in our own factory is a small part of its footprint, about 2%. Our factory in China moved into a new building with solar panels on the roof in October 2025.
~2%
Share of the climate footprint, average of three EPDs
Transport to site and installation is about 4% of a product's footprint. We are close to our customers and mostly deliver by lorry. Products are sent directly to where they will be installed, which means fewer trips.
~4%
Share of the climate footprint, average of three EPDs
What a luminaire uses in service is the second largest part of its footprint. Light control and constant luminous flux bring it down, and the electricity can be bought from solar, wind or hydropower.
The figure is the electricity our products use over their service life, as their declarations state it. It is calculated with the Norwegian electricity mix, which is among the cleanest in Europe. With another country's mix the same luminaire would have a larger footprint in use, and the share would be higher.
~42%
Share of the climate footprint, average of three EPDs
We design our products with end of life in mind, making them easy to disassemble so materials can be recovered, recycled and reused in new products. Handling at end of life is about 2% of the footprint. What is recovered gives back about 4% on top, which the declarations report separately and we do not subtract here.
~2%
Share of the climate footprint, average of three EPDs
The wheel above is the average of three of our published EPDs. Here is the same value chain as a staircase, for the average and for each product.
92% of a luminaire's footprint sits in two steps: the materials it is made of, and the electricity it uses. Production, transport and end of life together are under 8%.
8.3kg CO₂e Junistar Bio over its life, after the recycling credit. 48% materials, 47% in use. NEPD-6964-6353
24.6kg CO₂e Hurdal 600 over its life, after the recycling credit. 46% materials, 46% in use. NEPD-8677-8357
53.8kg CO₂e Sense Basic 600x600 over its life, after the recycling credit. 55% materials, 35% in use. NEPD-11014-9971
GWP-total from each declaration, per luminaire over its service life. The declarations are for SG Armaturen in Norway and use the Norwegian electricity mix, among the cleanest in Europe. In countries with a more fossil mix, the share in use is higher.
A balance between economy, environment and people.
The roof in Lillesand powers part of the building it covers.
Total emissions 2025 140.3M kg CO₂e
Select a part to see its sources
Fuel burned in our own vehicles. We have no stationary combustion and no process emissions.
Share of total
0.33%
Measured
467,000 kg CO₂e
Sources within Scope 1
Bars compare sources with each other, not with the other panels. The band above carries the true proportions.
Emissions from the electricity and heat we purchase
Share of total
0.02%
Measured
30,000 kg CO₂e
Sources within Scope 2
Bars compare sources with each other, not with the other panels. The band above carries the true proportions.
Products we produce, their transport, and the energy they use over their lifetime. Products without an EPD, about 15% of turnover, are not counted here.
Share of total
99.64%
Measured
139,797,000 kg CO₂e
Sources within Scope 3
Bars compare sources with each other, not with the other panels. The band above carries the true proportions.
* Calculated with the Norwegian electricity mix in every market. For 2026 we will work to calculate and report this more precisely.